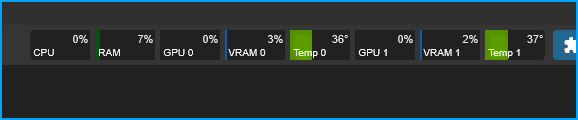
ComfyUI System Monitor
Check out the github repo: ComfyUI-Crystools
ComfyUI-Crystools - Brief Overview Crystools is a “Swiss Army knife” toolkit that adds monitoring, debugging, and workflow organization tools to ComfyUI. Main Features:
- Real-Time Resource Monitor - See CPU, GPU, RAM, VRAM, GPU temp, and disk space usage right in the menu bar
- Progress Bar - Visual progress indicator showing workflow completion and time elapsed
- Metadata Tools - Extract, view, and compare image metadata (prompts, workflows, settings)
- Debug Nodes - Display/console output to inspect any value in your workflow
- Pipe Nodes - Bundle multiple connections into single “pipes” to clean up messy workflows
- Enhanced Load/Save - Load images with subfolder support, save with custom metadata
- Switch Nodes - Toggle between different workflow paths with boolean switches
- Comparison Tools - Compare two images’ metadata or JSONs side-by-side
Prerequisites
- ComfyUI
- ComfyUI Manager (optional)
Option 1 - Install w/ ComfyUI Manager
Once you have ComfyUI Manager installed you can install lots of custom nodes from the manager.
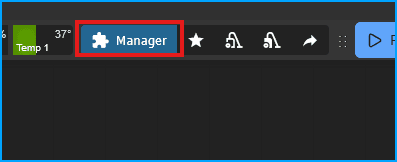
Open up the Manager
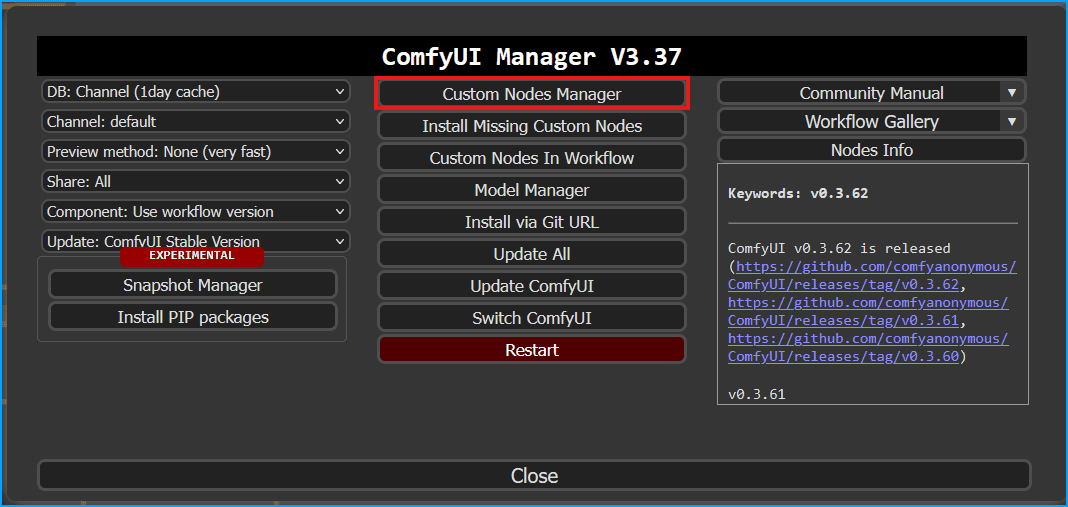
Select “Custom Nodes Manager”
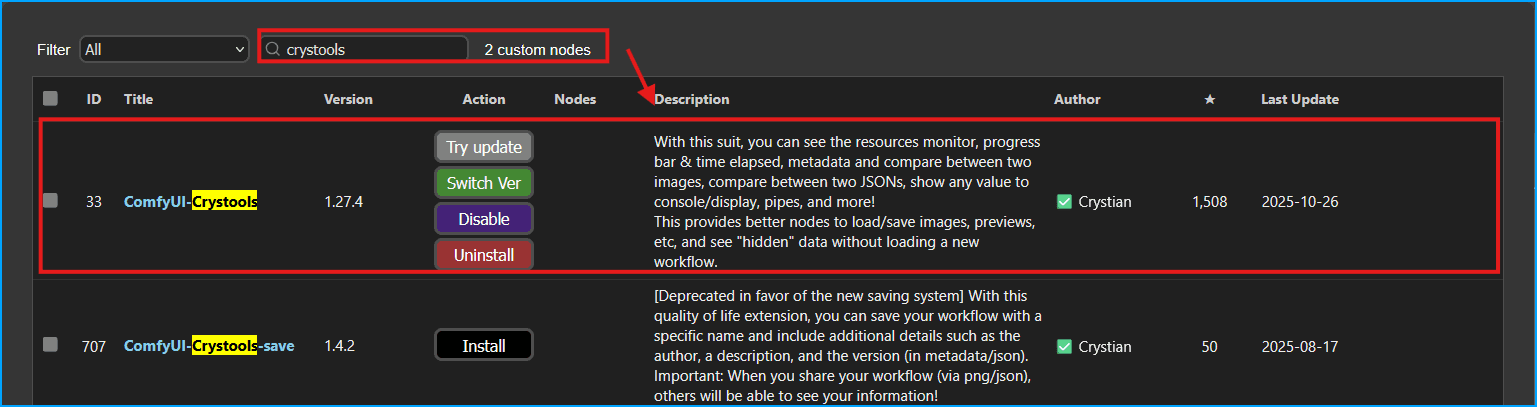
Search for “Crystools” then click “Install”
You will need to restart ComfyUI, either select the option to restart in Comfy Manager or move to your terminal and press CTRL+C to stop the server, then start it again.
Option 2 - Install w/ Git
Stop ComfyUI if running.
Navigate to the custom_nodes folder
cd ~/ComfyUI/custom_nodesThen clone the repo
git clone https://github.com/crystian/comfyui-crystools.gitMove into the directory
cd comfyui-crystoolsEnter virtual environment
source ~/ComfyUI/venv/bin/activateInstall requirements
pip install -r requirements.txtStart ComfyUI
Now start ComfyUI and you should see the system monitor.
python main.py --listen 0.0.0.0